Two Years of Longshore Migration Counts
Indiana Dunes State Park
2024–2025
Abstract
Spring diurnal migration was documented during 2024 and 2025 from the Indiana Dunes State Park Longshore Flight Tower using a standardized protocol that has remained consistent for more than a decade. The 2024 and 2025 seasons represent Indiana Audubon’s first two years administering the survey following a transition in program oversight and funding support. Surveys follow a standardized protocol that has remained consistent for more than a decade and are designed to quantify resumed morning migration, when nocturnal migrants depart shoreline stopover habitat shortly after sunrise under favorable winds. Historical monitoring from 2012–2021 recorded a cumulative 2,655,818 birds, with annual totals ranging from 185,180 to 428,374 individuals. During the 2024 season, 231,759 individuals representing 247 species were recorded. In 2025, 181,518 individuals representing 253 species were documented. Migration was highly concentrated into episodic peak events, with 43–48% of each season’s total occurring during the five largest flight days. March accounted for 56–59% of seasonal passage in both years. Passage was dominated by passerines and other landbirds, which comprised more than 92% of individuals recorded. These results extend the long-term documentation of longshore migration at Indiana Dunes and reinforce the site’s importance as one of the most significant visible migration corridors in the southern Great Lakes region.
Introduction
The southern end of Lake Michigan is widely recognized as a migratory funnel during spring. Northbound birds encountering the lake frequently concentrate along the shoreline before continuing their journey. While much migration occurs at night, a substantial component becomes visible after sunrise as birds resume movement from stopover habitat under favorable wind conditions. This morning movement, commonly referred to as longshore flight or morning flight, can produce large and highly concentrated pulses of migrants along the dune and shoreline corridor.
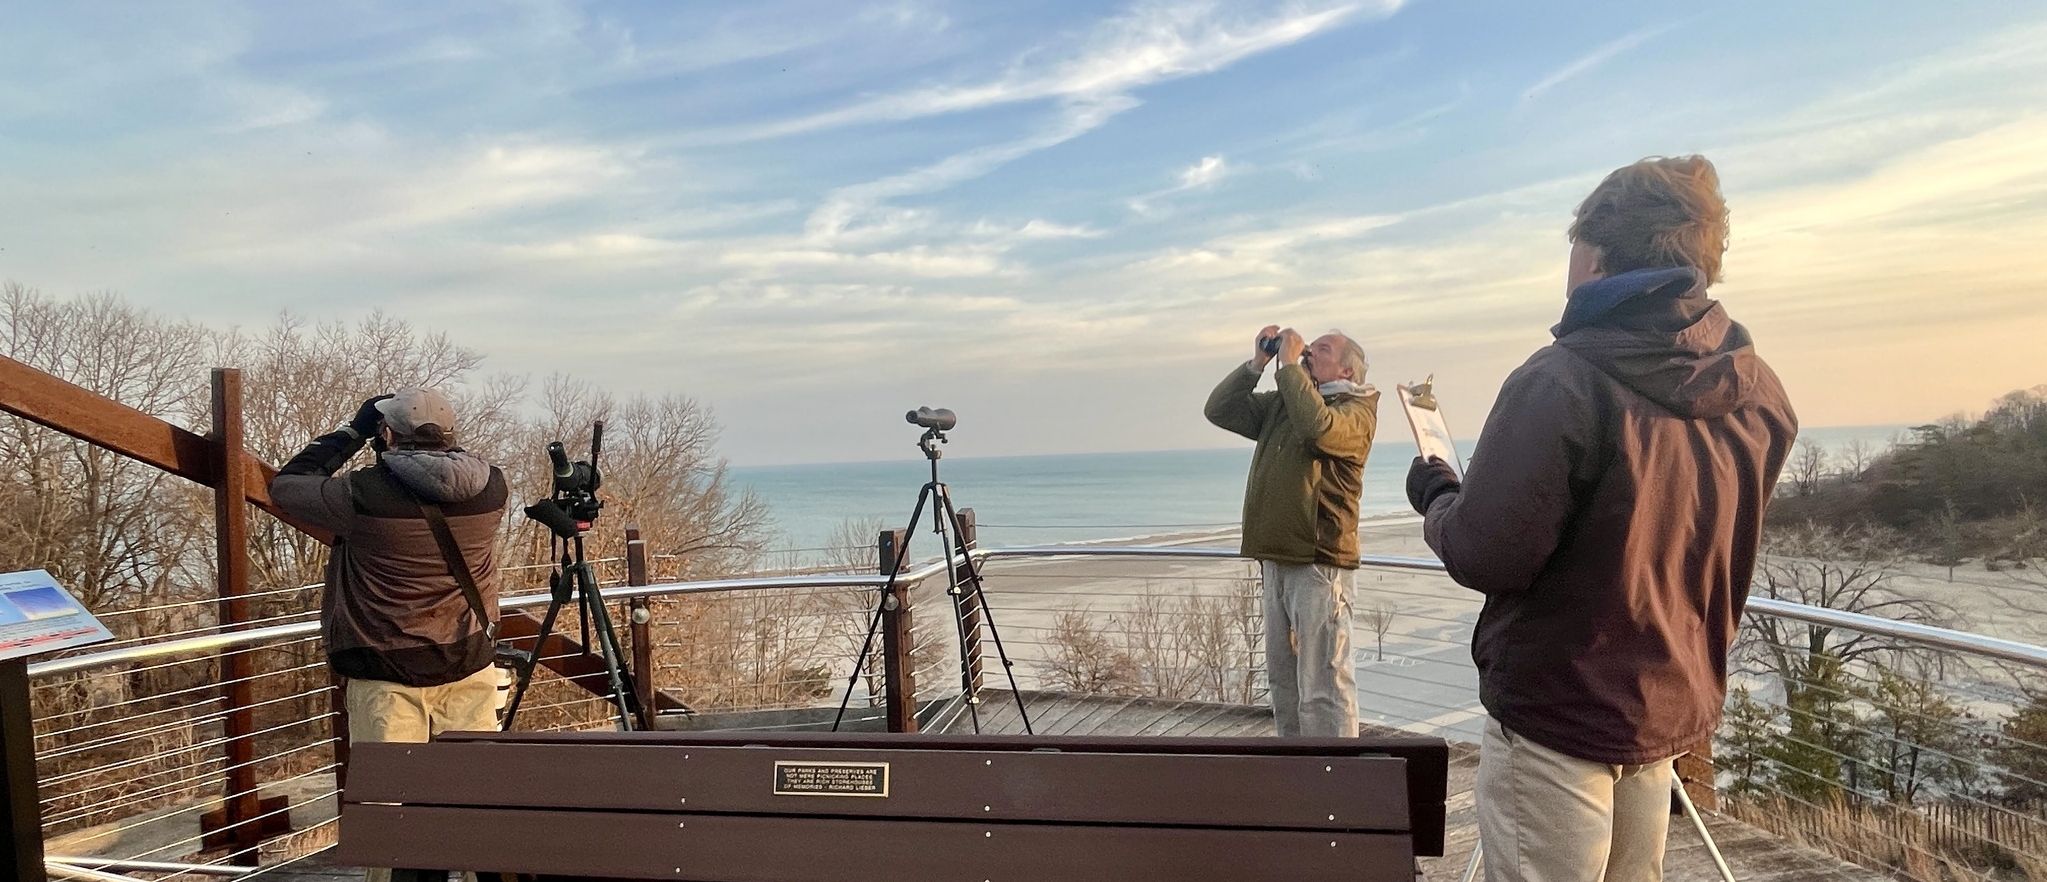
At Indiana Dunes State Park, longshore flights have been documented from the Longshore Flight Tower for more than a decade using a consistent standardized protocol. The elevated vantage point atop a 60-foot dune provides broad views of the Lake Michigan shoreline and adjacent dune and prairie habitats, allowing observers to quantify resumed diurnal migration across a wide airspace. Between 2012 and 2021, monitoring recorded a cumulative total of 2,655,818 birds, with annual totals ranging from 185,180 to 428,374 individuals. These historical counts establish Indiana Dunes as one of the most productive and dynamic visible migration sites in the region.
A major programmatic shift occurred beginning in the 2024 season. The Indiana Dunes State Park Division of State Parks relinquished oversight of survey administration, and a portion of program funding was shifted from State Parks to Indiana Audubon through the Lake Michigan Coastal Program. Indiana Audubon assumed responsibility for survey administration and grant reporting while maintaining the established field protocol.
The 2024 and 2025 seasons therefore represent Indiana Audubon’s first two years of administering the longshore flight count. The purpose of this article is to summarize seasonal abundance, species richness, timing, and flight composition during these two seasons, and to describe how migration intensity is distributed across days and months. By presenting these results under a consistent protocol, this article provides both a recent seasonal summary and a clear baseline for Indiana Audubon’s continued stewardship of longshore migration monitoring at Indiana Dunes State Park.
Study Site
Counts were conducted at the Indiana Dunes State Park Longshore Flight Tower/Observation Tower in Chesterton, Indiana. The observation platform is located atop a 60-foot sand dune and includes a 20-foot observation deck. The site overlooks Lake Michigan to the north and provides unobstructed views over the Dunes Prairie Nature Preserve to the south. The count area consists of all visible airspace surrounding the tower, including movement along the lake edge and over adjacent dune and prairie habitats.
To maintain consistency and avoid inflating totals with birds detected away from the core count area, birds observed on foot more than approximately 200 meters from the tower were not included in daily totals.

Methods
Seasonal Framework
Counts were conducted during the core spring migration period. Rather than beginning strictly on a fixed calendar date, surveys were initiated on the first suitable southerly or southwesterly migratory wind event occurring within one week of March 1. This flexible start date reflects the onset of favorable longshore migration conditions and allows survey effort to align with biologically meaningful flight days. The season continued through May 31. Survey effort was prioritized on days with winds generally from the south through west. Northerly winds were avoided, when possible, as these conditions tend to suppress or alter shoreline morning flight dynamics.
Daily Survey Protocol
Counts began 15 minutes prior to sunrise and continued for at least two hours after sunrise. In most cases, surveys continued for approximately four hours after sunrise. Surveys ended early only when migration activity declined substantially for a sustained 30-minute period. Surveys were extended beyond four hours when active migration persisted, particularly for thermal migrants such as Sandhill Cranes and raptors, which often move later in the morning as conditions develop.
Data Collection and Proofing
A primary counter conducted each survey, often with assistance from volunteer observers. Birds were recorded in real time using pencil and paper, clickers, and/or the eBird mobile app. Secondary observers contributed sightings when appropriate, and additional observer effort was noted in field comments. At the end of each survey day, counts were entered into eBird under the hotspot “Indiana Dunes SP—Observation Tower.” Seasonal proofing was conducted via complete eBird data download at the end of each season.
Effort Standardization
Because survey duration varied modestly by day, flight intensity was standardized as birds per hour. Checklist-level birds per hour were calculated by dividing total individuals recorded by survey duration in hours. This metric was summarized by year to compare relative flight intensity.
Results Overview
2024 Season
2025 Season
Standardized Flight Intensity (Birds per Hour)
2024
2025
Daily Flight Distribution
Daily totals were strongly right-skewed in both years, with most days producing moderate totals and a small number of days producing exceptionally large flights. Migration volume was highly concentrated into a small number of peak flight days:
- 2024: The five largest flight days accounted for 48.4% of the seasonal total
- 2025: The five largest flight days accounted for 42.9% of the seasonal total
2024 Daily Totals
2025 Daily Totals
Monthly Distribution (March–May)
Total birds counted by month across the 2024 and 2025 seasons. March dominates both years with over 56% of total seasonal passage.
Peak Flight Days
2024 Peak Day
2025 Peak Day
Flight Intensity Comparison
Mean and median birds per hour across both seasons, showing the intensity of migration activity.
Flight Composition by Species Guilds
Passerines and other landbirds dominated seasonal totals in both years, comprising over 92% of individuals recorded in 2024 and 95.5% in 2025. This is consistent with the early-season dominance of blackbirds, robins, and other songbirds utilizing shoreline migration corridors.
2024 Species Guilds
2025 Species Guilds
Phenology of Five Focal Species
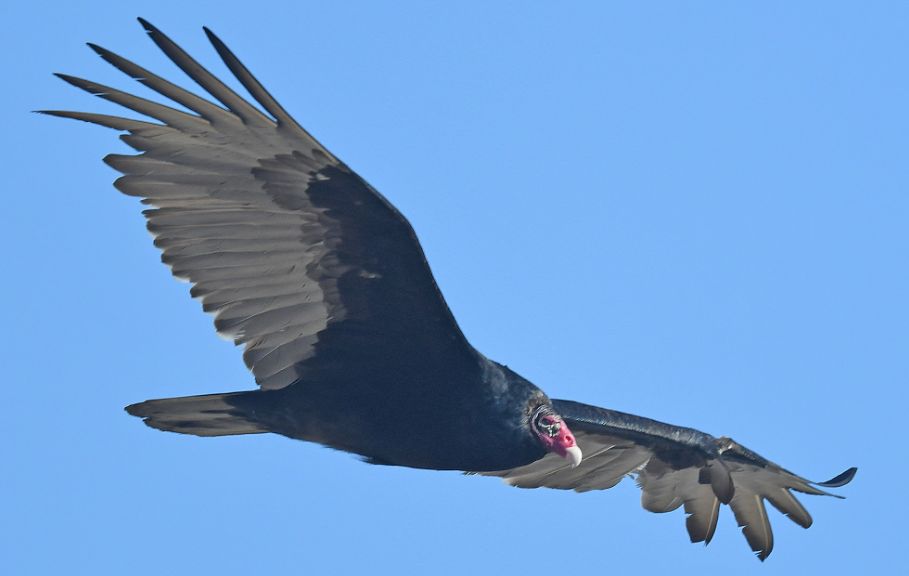
Five focal species were selected to represent dominant and ecologically distinct components of the longshore flight. Seasonal timing was summarized using peak day counts and cumulative passage metrics (10%, 50%, and 90% of seasonal totals). The charts below show how these species redistribute their migration timing across the spring season, from early arrivals like Canada Goose to later migrants like Tree Swallow and Turkey Vulture.
Species Phenology: Seasonal Passage Timing
Cumulative passage of five focal species during spring 2024, showing when 10%, 50%, and 90% of each species’ seasonal total has passed through Indiana Dunes.
Detailed Species Data
Red-winged Blackbird
2024
Red-winged Blackbird
2025
American Robin
2024
American Robin
2025
Canada Goose
2024
Canada Goose
2025
Tree Swallow
2024
Tree Swallow
2025
Turkey Vulture
2024
Turkey Vulture
2025
Discussion
The 2024 and 2025 seasons extend more than a decade of longshore flight monitoring at Indiana Dunes State Park under a consistent standardized protocol. With 231,759 birds recorded in 2024 and 181,518 in 2025, both seasons fall within the historical range documented between 2012 and 2021. The continuation of this dataset under Indiana Audubon administration provides a stable baseline for long-term documentation of visible spring migration along the southern Lake Michigan shoreline.
The most striking pattern in both years was the extreme concentration of migration into a small number of peak flight days. Nearly half of each season’s total occurred during only five survey days. This pattern reinforces the episodic nature of spring migration at the site. While daily movement can be steady, the largest totals are driven by specific weather windows that produce large-scale resumed migration shortly after sunrise. The substantial difference between mean and median daily totals further illustrates this right-skewed distribution.
March accounted for more than half of total seasonal passage in both years. This dominance of early-season movement is consistent with the large numbers of blackbirds, robins, cranes, grackles, and other early migrants that utilize shoreline stopover habitat before resuming northbound movement. April contributed a strong secondary pulse, particularly for species such as Tree Swallow and Turkey Vulture, while May represented a tapering phase of the season.
Passerines and other landbirds comprised more than 92 percent of all individuals recorded in both years. The top species lists reflect this dominance, with Red-winged Blackbird, Common Grackle, American Robin, and Cedar Waxwing ranking among the most abundant taxa. Sandhill Crane also contributed substantial seasonal totals, particularly in 2024, highlighting the visibility of large-bodied migrants within the longshore corridor.
The phenology summaries of focal species illustrate how different taxa move through the season. Blackbirds and robins showed concentrated passage in March, often producing dramatic single-day peaks. Tree Swallow passage was centered in April, while Turkey Vulture exhibited a broader distribution extending into mid-May. Canada Goose showed early peaks but maintained a longer seasonal tail, reflecting a combination of migratory and regional movement dynamics.
Although year-to-year totals differed, overall seasonal structure was consistent between 2024 and 2025. Both years exhibited strong March dominance, pronounced peak days, and passerine-driven totals. This structural consistency supports the value of the longshore flight count as a repeatable index of visible diurnal migration at Indiana Dunes.
Continued monitoring will allow Indiana Audubon to extend this long-term dataset and further document variability in seasonal magnitude, timing, and species composition. As one of the most productive visible migration sites in the southern Great Lakes region, the Indiana Dunes longshore corridor remains an important location for observing and quantifying spring migration at scale.
Key Findings Summary
- Exceptional Concentration: 43–48% of each season’s total migration occurred during just five peak flight days
- March Dominance: Over 56% of seasonal passage concentrated in March in both years
- Passerine-Driven: More than 92% of birds were passerines and other landbirds, dominated by blackbirds and robins
- Peak Event Variability: Single-day peaks ranged from 56,296 birds (March 3, 2024) to 20,553 birds (March 14, 2025)
- Species-Specific Timing: Different focal species peak at different times—early migrants (March) to late migrants (May)
- Seasonal Consistency: Both years displayed consistent overall patterns despite year-to-year variation in magnitude
- Long-Term Significance: Since 2012, cumulative monitoring now exceeds 3.4 million birds recorded under consistent protocol
- Regional Importance: Indiana Dunes represents one of the most productive visible migration corridors in the southern Great Lakes